Urban Revolution through Data
Urban3’s visual approach to understanding property values in cities and towns
Imagine you own a house on a 1/4 acre lot. Meanwhile, your neighbor a few blocks down has a full acre lot. What value does your land have, compared to your neighbor’s land?

By Rachel Quednau
She has more yard space than you, but your homes are fairly similar in size, age, and quality, so you’d think her lot would be valued about the same amount per acre, for tax purposes, right?
In most cities, that is—insanely—not the case. When the folks at Urban3—a geoanalytics consulting firm based in Asheville, NC— realized this, they began to see America’s financial challenges in a whole new light. Why are so many cities falling into debt, struggling to provide services and failing to undertake basic maintenance projects like fixing potholes and keeping the street lights on? At their root, these problems stem from the way we value our land for tax purposes.
While your lot may be valued at several million dollars per acre, your neighbor’s might well be valued at half as much per acre. That means that, for the amount of space your neighbor takes up and the amount of infrastructure she uses—think roads, sidewalks, pipes, street lights, and everything else required to service a large space—she’s paying way less than you in taxes. This manner of valuing properties based on their land use rather than infrastructure use, location, or any number of other ways we might better get at the true value of space is outmoded and illogical.
Now multiply this out across your entire city, and you’ll see the magnitude of the problem. The Walmart on the edge of town requires miles of pipes, roads, and electric lines to run out to it, yet is paying a tiny fraction in taxes for the amount of infrastructure it uses, compared with a modest downtown building with a donut shop on the first floor and a few one-bedroom apartments above.
What’s more, our messed up tax structure is incentivizing more of the former and less of the latter. Instead of focusing on walkable urban cores with historic buildings that can house many different businesses and uses over the course of a century (and look good while doing it!), our cities keep building cheap, sprawling, low-value places that, in all likelihood, won’t even be in use twenty years from now. And all this, because of the way our tax policies have encouraged us to build.
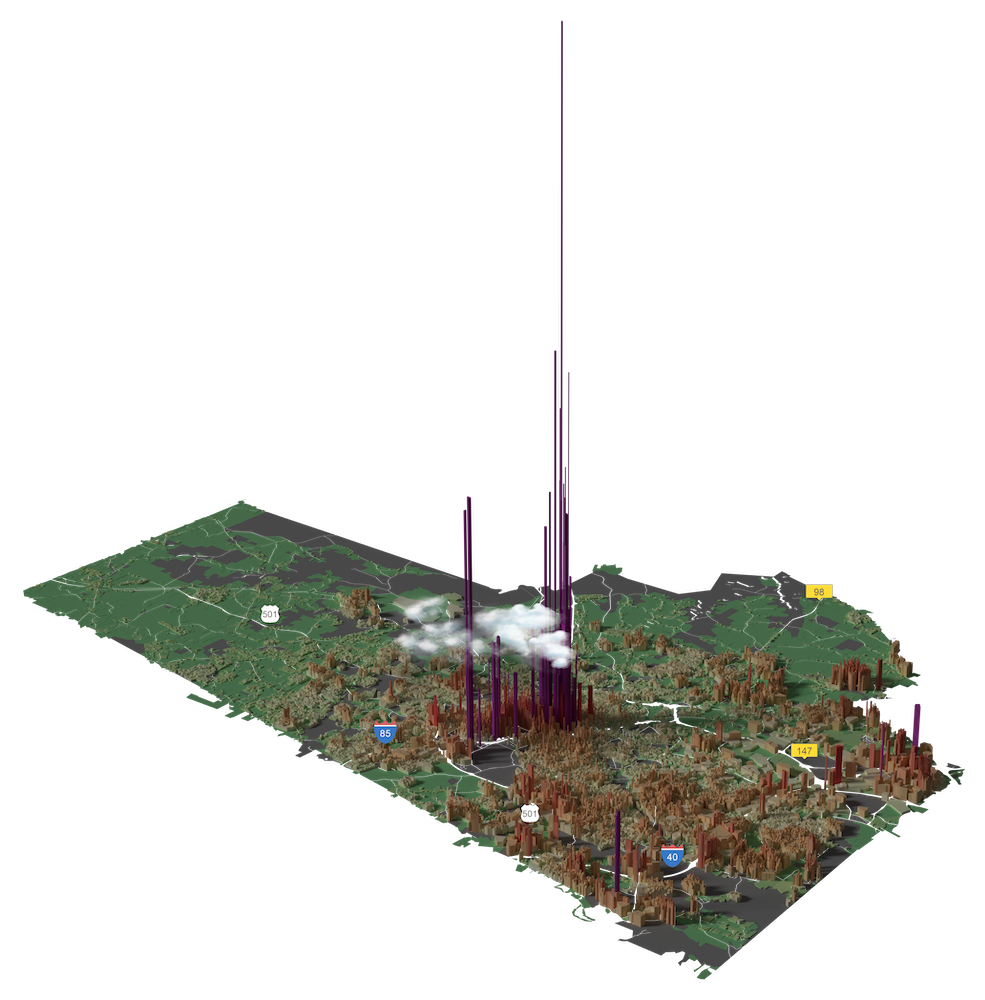
An Urban3 data visualization mapping tax value per acre in Durham, NC.
The Challenge
This valuation quirk is what drives the groundbreaking work of Urban3. Principal at Urban3, Joe Minicozzi, recalls a conference of the International Association of Assessing Officers where he approached the microphone after a presentation to ask a simple question: Why? Why are lots assessed in this manner?
Why are we incentivizing people to essentially build cheap, short-term low value buildings so they can pay less taxes on it? He couldn’t get a straight answer out of anyone.
Urban3 works every day to lift the veil on property assessments, valuations and tax policy for cities across the United States, helping them understand where their revenue is coming from and why. Most importantly, Urban3 collaborates with cities to help them forge new public policies to enable communities to meet their revenue needs so they can patch those potholes, get out of municipal debt and actually create the cities their residents desire—for now and for future generations.
Lancaster, California, located in northern Los Angeles County, provides a perfect example of the Urban3 model in action. Urban3’s Chief Analytics Researcher, Josh McCarty, describes the desert city as “a more extreme version of the same pattern that happens everywhere in this country—where our approach to the good life is to accept the status quo and not think about the future costs of our infrastructure.” Lancaster has miles of sprawling subdivisions, fast food restaurants, and big box stores—in other words, lots of low-value buildings requiring tons of local infrastructure to support them. And it is not a wealthy community by any means; more than 20% of the population lives below the poverty line, and the median household income for the city is several thousand dollars below the U.S. median.
These circumstances combine to put Lancaster in a precarious financial position. They have built a large amount of infrastructure in a short amount of time, and they have no real prospect of paying for it over the long term. “This is a boomtown in the desert,” says Minicozzi. “They’re very aware of their vulnerabilities. If they don’t play their cards right long term, there are so many things that could wipe them out. Living in the desert makes them more aware of it, but it’s true for everyone.” So Lancaster invited Urban3 to conduct what they call an “Economic MRI” on the city in 2016 to help Lancaster residents and officials understand where exactly their money is coming from.
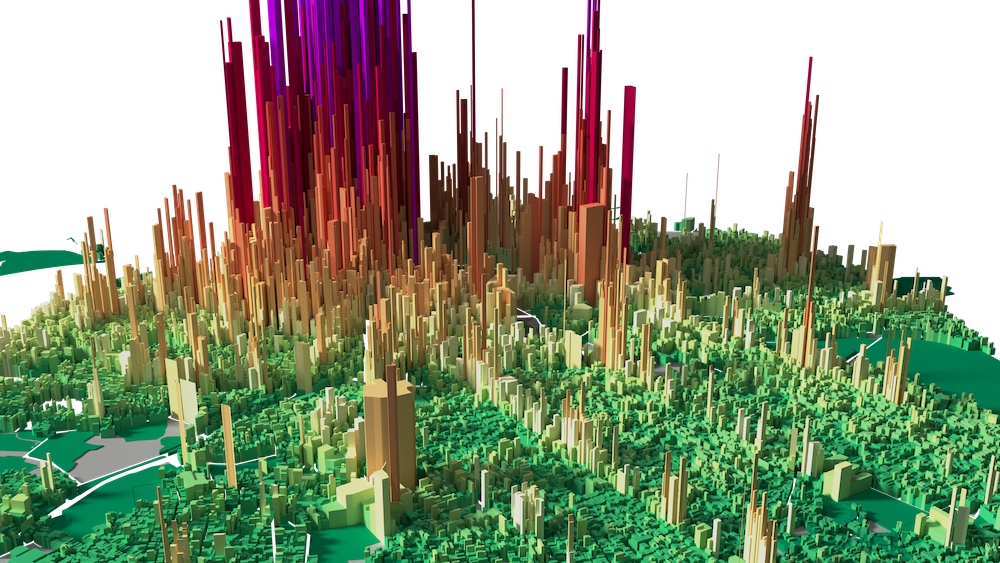
Tax value per acre visualized for Auckland, New Zealand.
The Process
Urban3’s process for working with each city is tailored to that city’s questions and goals. “People are always calling us for a reason,” says Cate Ryba, a project manager and planner at Urban3. “It may just be something in their gut knowing things aren’t right in their city, or it could be a particular public policy goal.” Whatever the motivation, Urban3’s consulting always starts with the team’s analysts, who dig deep into every piece of revenue and cost data they can get their hands on, learning a city’s codes, their tax system, and unique quirks. This part isn’t easy; many elected officials and city staffers don’t even have a real grasp on what’s happening with their own tax structure, and every city’s codes vary dramatically.
McCarty explains that the data collection and analysis process requires finesse and careful examination: “You get the data, you wrestle with it, and eventually it’ll show you its secrets… Then you figure out how to communicate those secrets.” One key revelation that came out of Urban3’s investigation of Lancaster’s data was that the city’s downtown business district was worth nearly two and a half times as much per acre as the rest of the land. And that business district is using far fewer local resources to operate. A huge imbalance was in place.
The next phase in Urban3’s consulting process brings the team together to “storyboard” the whole situation. They discuss the stakeholders, history, and challenges of this particular city, then they synthesize everything. Special issues for Lancaster included California’s Proposition 13 (which limits the amount that property taxes can be increased each year), the ratio of taxable to tax-exempt land in the city (much of the exempt land is in the highest value areas, representing a potential missed opportunity to collect tax revenue), and the dispersal of municipal infrastructure across a large land area with a relatively small population. Once the Urban3 team had assessed all these particulars, they pulled them together into an engaging presentation.
“I think that’s what makes our work stick,” says Minicozzi. “It’s not just the coldness of data, it’s a story we’re telling.” A huge part of that story is the dazzling and compelling graphics that Urban3 crafts to communicate each city’s tax value per acre. Using tools like Esri, ArcGis, and Blender, the team at Urban3 illustrates the value of every plot of land in a given city, per acre, in colorful, 3-dimensional visuals. It’s this orientation toward design and visual presentation that allows Urban3 to so clearly and powerfully communicate the problems a city is facing—and the potential solutions they might find. Most of the staff at Urban3 don’t have design degrees, but they all have a visual eye and inclination toward using design tactics to tell their stories.
With the community’s economic story assembled, Minicozzi and other team members head to the city to present their findings to elected officials, chambers of commerce, downtown associations and any other key stakeholders as needed. Their presentations involve personal narratives, nods to each city’s unique history and issues, and, chiefly, tons of those visually engaging illustrations of the city’s tax value per acre and other pertinent markers. Afterward, Urban3 also shares a final report with the city and sometimes, an interactive “storymap” that tells the city’s financial story and includes Urban3’s graphics.
Outcome
In Lancaster, Urban3 was able to visualize for local leaders the value per acre of every property in the city, showing just how much value the historic, compact, mixed-use downtown properties were generating compared with much of the rest of the area, which is sprawling one-story buildings and large parking lots. Urban3 drilled down into some specific examples to further make their point; for instance, a modestly-sized restaurant in walkable downtown Lancaster is valued at nearly $8 million per acre, compared with a Walmart on the edge of town valued at less than $1 million per acre. The team also highlighted the way that the state’s Proposition 13 distorts property values in Lancaster, over-inflating the assessed values of newer properties and suppressing the real values of older properties. Urban3 was also able to illustrate that even with this assessment distortion, the older, city center properties are still contributing much more to the tax base per acre than the newer buildings.
Other powerful visuals created for Lancaster include a comparison between taxable and non-taxable land in the downtown vs. the city overall. Urban3 was able to expose just how much downtown land—41%—in the most valuable area of the city was not currently being taxed. As the team explained to local leaders, those non-taxable areas (schools, parks, government buildings, etc.) have a social value, of course, but their lack of monetary value must be taken into account when considering the amount of profitable land they occupy. For some perspective, Urban3 also shared with leaders in Lancaster their value per acre findings from another similarly populated California city, Santa Rosa. Urban3 illustrated the dramatic difference in mean value per acre in Santa Rosa—$1.8 million—compared with Lancaster—a mere, $710,000.
After the big reveal of the city’s Economic MRI showing where the money was really coming from (and where it wasn’t) Lancaster was soon eager for more data. They invited Urban3 back to conduct a Fiscal MRI, showing where municipal money is going and comparing costs vs. revenue.
Now Urban3 is in a third phase of work with Lancaster. They know where their money comes from and where it’s going; now Urban3 is collaborating with the city to connect these two things. They are developing what’s called a “form-based fee” to ensure that properties are being adequately taxed for the infrastructure they use. This sort of fee would be charged to property owners annually, as opposed to more typical impact fees, which many cities use for new developments on a one-time basis. By applying an annual form-based fee, Lancaster can ensure that ongoing infrastructure maintenance costs—the ones so many cities fail to appropriately plan for—are truly anticipated and guaranteed to be covered. This sort of user fee will also be easier to swallow than some sort of massive lump-sum tax hike. “The key is going to be making sure the city is prudent, and that the money stays in a reserve account,” says Minicozzi.
Lancaster seems to be moving in the right direction. They recently developed a document to help plan for the future of their city, which opens with a comparison between Lancaster and Machu Pichu. In short, they admit their city will die someday—great as it may be right now— and they are brave enough to envision what that death might look like. Only by recognizing this potential future can they anticipate their economic weaknesses and financial challenges, and attempt to mitigate them now.
Minicozzi and his team know that the form-based fee is only the beginning. “Ultimately, that will lead to the realization that one lever isn’t enough,” says Minicozzi. “They’ll need a constellation of policies, working together, to get the results they want.”
The most crucial insight of Urban3’s work is the need for new approaches and ideas. The team never proscribes a solution to any city’s problems and they strongly encourage the city to think creatively. “There’s a tendency to want to go to a playbook and find the solution,” says Minicozzi. “That’s dangerous. One-size-fits-all solutions caused a lot of these problems in the first place.” Minicozzi sees promise in the City of Lancaster because of their willingness to shine a light on their own problems and to attempt to address them with an open mind.
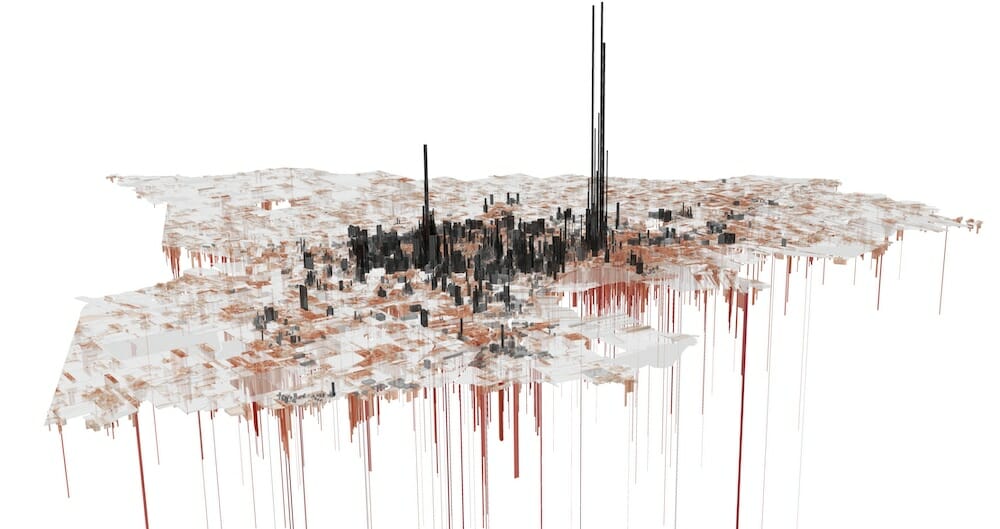
ROI of public infrastructure investment in Lancaster, CA.
Impact
Urban3 has consulted in dozens of cities, big and small, across the country. Their work may be focused on taxation and municipal finance, but it affects every aspect of city life from the water you drink, to the schools your kids attend, to the homes your grandchildren might one day live in. Previous consulting in U.S. cities has led to policy changes like the elimination of minimum parking requirements (which necessitate lots of productive land being used for a very low- value purpose) and the encouragement to construct more mixed-use multistory buildings and fewer big box stores. Urban3’s work points cities in the direction of compact, walkable neighborhoods that are designed to last, rather than single-use, asphalt-dominated structures like fast food restaurants, big box stores, and winding culs-de-sac.
Urban3’s revelations have also made their mark on other leading organizations that work in the fields of urban planning, transportation, and municipal governance. The nonprofit media organization, Strong Towns, for example, frequently employs Urban3’s illustrations and concepts in its publications to help towns and cities around the nation understand their weakness and become more economically resilient. Strong Towns also partners with Urban3 to talk about the social, political, and design implications of tax data and policy.
What’s particularly powerful about Urban3’s approach is that it cuts across political dividing lines. The numbers don’t lie, so to speak, and the data isn’t biased. Urban3 has seen success in small right-leaning towns and bigger left-leaning cities alike. Solutions turn from being based in partisan values to being rooted in what makes economic sense. Simply put, our tax system rewards sprawl and poorly designed cities, as well as throwaway buildings.
The team at Urban3 knows that only by lifting the veil on tax productivity and property valuation can a city truly understand its financial challenges. It’s their mission to help cities do this, and then to help them build a better way forward for today’s residents and for future generations to come.